Colorizer

이탤릭 볼드 이탤릭볼드
Workflow stages
- Question or problem definition.
- Acquire training and testing data.
- Wrangle, prepare, cleanse the data.
- Analyze, identify patterns, and explore the data.
- Model, predict and solve the problem.
- Visualize, report, and present the problem solving steps and final solution.
- Supply or submit the results.
기본적으로 설치되어 있어야하는 패키지는 아래 코드 를 사용한다.
import cv2 # opencv 3.4.2+ required
import numpy as np
import sys
import matplotlib.pyplot as plt
data 가져오기
#인터넷에서 모델 다운
# https://github.com/richzhang/colorization/blob/master/colorization/resources/pts_in_hull.npy?raw=true /models/pts_in_hull.npy
# https://raw.githubusercontent.com/richzhang/colorization/master/colorization/models/colorization_deploy_v2.prototxt /models/colorization_deploy_v2.prototxt
# http://eecs.berkeley.edu/~rich.zhang/projects/2016_colorization/files/demo_v2/colorization_release_v2.caffemodel /models/colorization_release_v2.caffemodel
# http://eecs.berkeley.edu/~rich.zhang/projects/2016_colorization/files/demo_v2/colorization_release_v2_norebal.caffemodel /models/colorization_release_v2_norebal.caffemodel
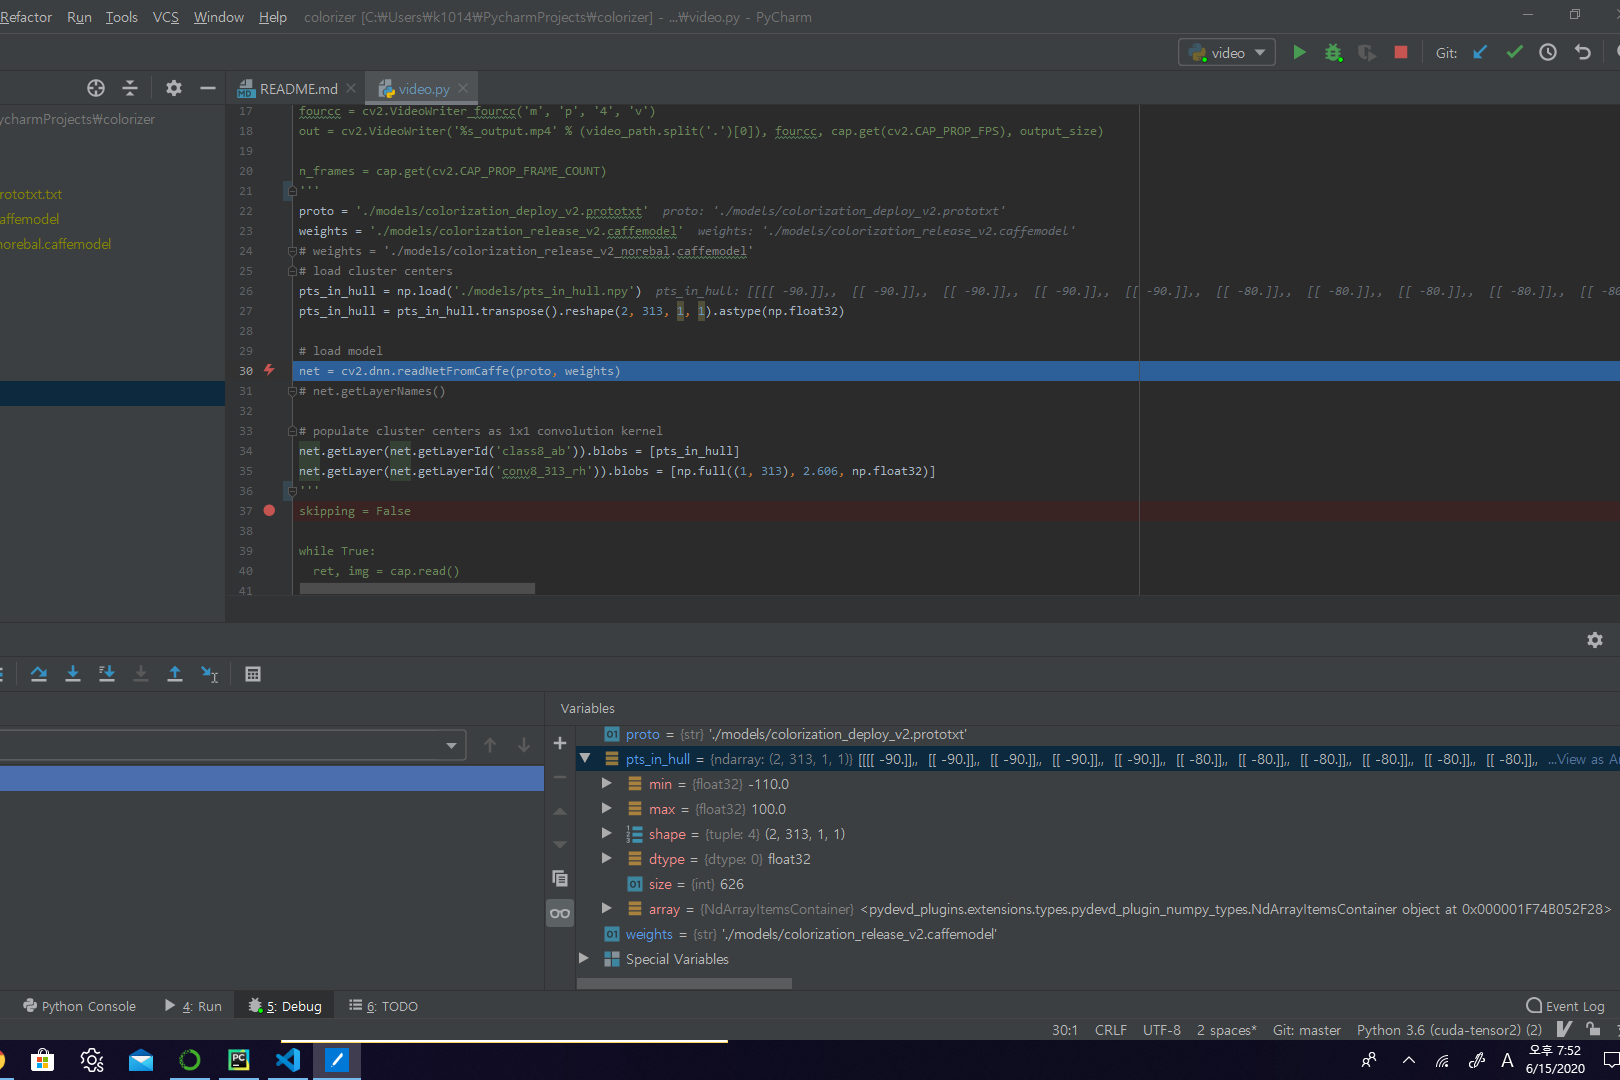
모델 불러오기
proto = './models/colorization_deploy_v2.prototxt'
weights = './models/colorization_release_v2_norebal.caffemodel'

# load cluster centers
pts_in_hull = np.load('./models/pts_in_hull.npy')
pts_in_hull = pts_in_hull.transpose().reshape(2, 313, 1, 1).astype(np.float32)

# load model
net = cv2.dnn.readNetFromCaffe(proto, weights)


# populate cluster centers as 1x1 convolution kernel
net.getLayer(net.getLayerId('class8_ab')).blobs = [pts_in_hull] # cluster centers를 넣음
net.getLayer(net.getLayerId('conv8_313_rh')).blobs = [np.full((1, 313), 2.606, np.float32)] # 모든 weight를 2.606으로 채움
전처리
img_path = 'img/sample_23.jpg'
img = cv2.imread(img_path, cv2.IMREAD_GRAYSCALE)
img_input = img.copy()
# convert BGR to RGB
img = cv2.cvtColor(img, cv2.COLOR_GRAY2RGB) # 흑백이미지를 RGB로 변환하나 실제 채널만 증가하고 색은 변하지 않음
img_rgb = img.copy()
# normalize input
img_rgb = (img_rgb / 255.).astype(np.float32)
# convert RGB to LAB
img_lab = cv2.cvtColor(img_rgb, cv2.COLOR_RGB2Lab) # LAB라는 색형식으로 변환
# only L channel to be used
img_l = img_lab[:, :, 0] # 연관 채널 사용.
input_img = cv2.resize(img_l, (224, 224))
input_img -= 50 # subtract 50 for mean-centering
# plot images
# fig = plt.figure(figsize=(10, 5))
# fig.add_subplot(1, 2, 1)
# plt.imshow(img_rgb)
# fig.add_subplot(1, 2, 2)
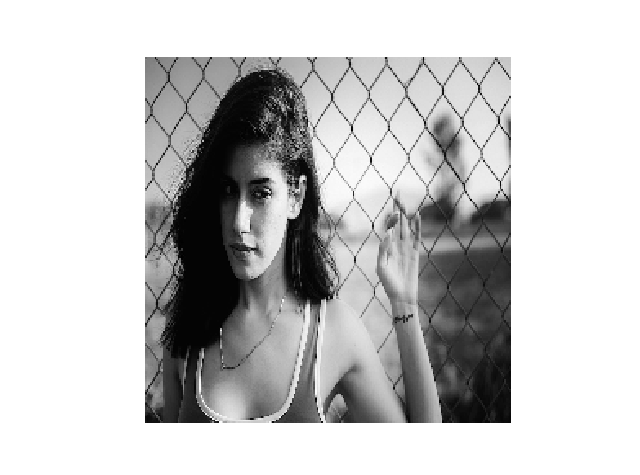
plt.axis('off')
plt.imshow(input_img, cmap='gray')
 >
>
Prediction
net.setInput(cv2.dnn.blobFromImage(input_img)) # 이미지를 blob 데이터로 변환 후 input으로 사용
pred = net.forward()[0,:,:,:].transpose((1, 2, 0)) # 이미지를 예측
# resize to original image shape
pred_resize = cv2.resize(pred, (img.shape[1], img.shape[0]))
# concatenate with original image L
pred_lab = np.concatenate([img_l[:, :, np.newaxis], pred_resize], axis=2) # np.concatenate() Numpy 행렬을 채널 방향으로 붙임
# convert LAB to RGB
pred_rgb = cv2.cvtColor(pred_lab, cv2.COLOR_Lab2RGB)
pred_rgb = np.clip(pred_rgb, 0, 1) * 255
pred_rgb = pred_rgb.astype(np.uint8)
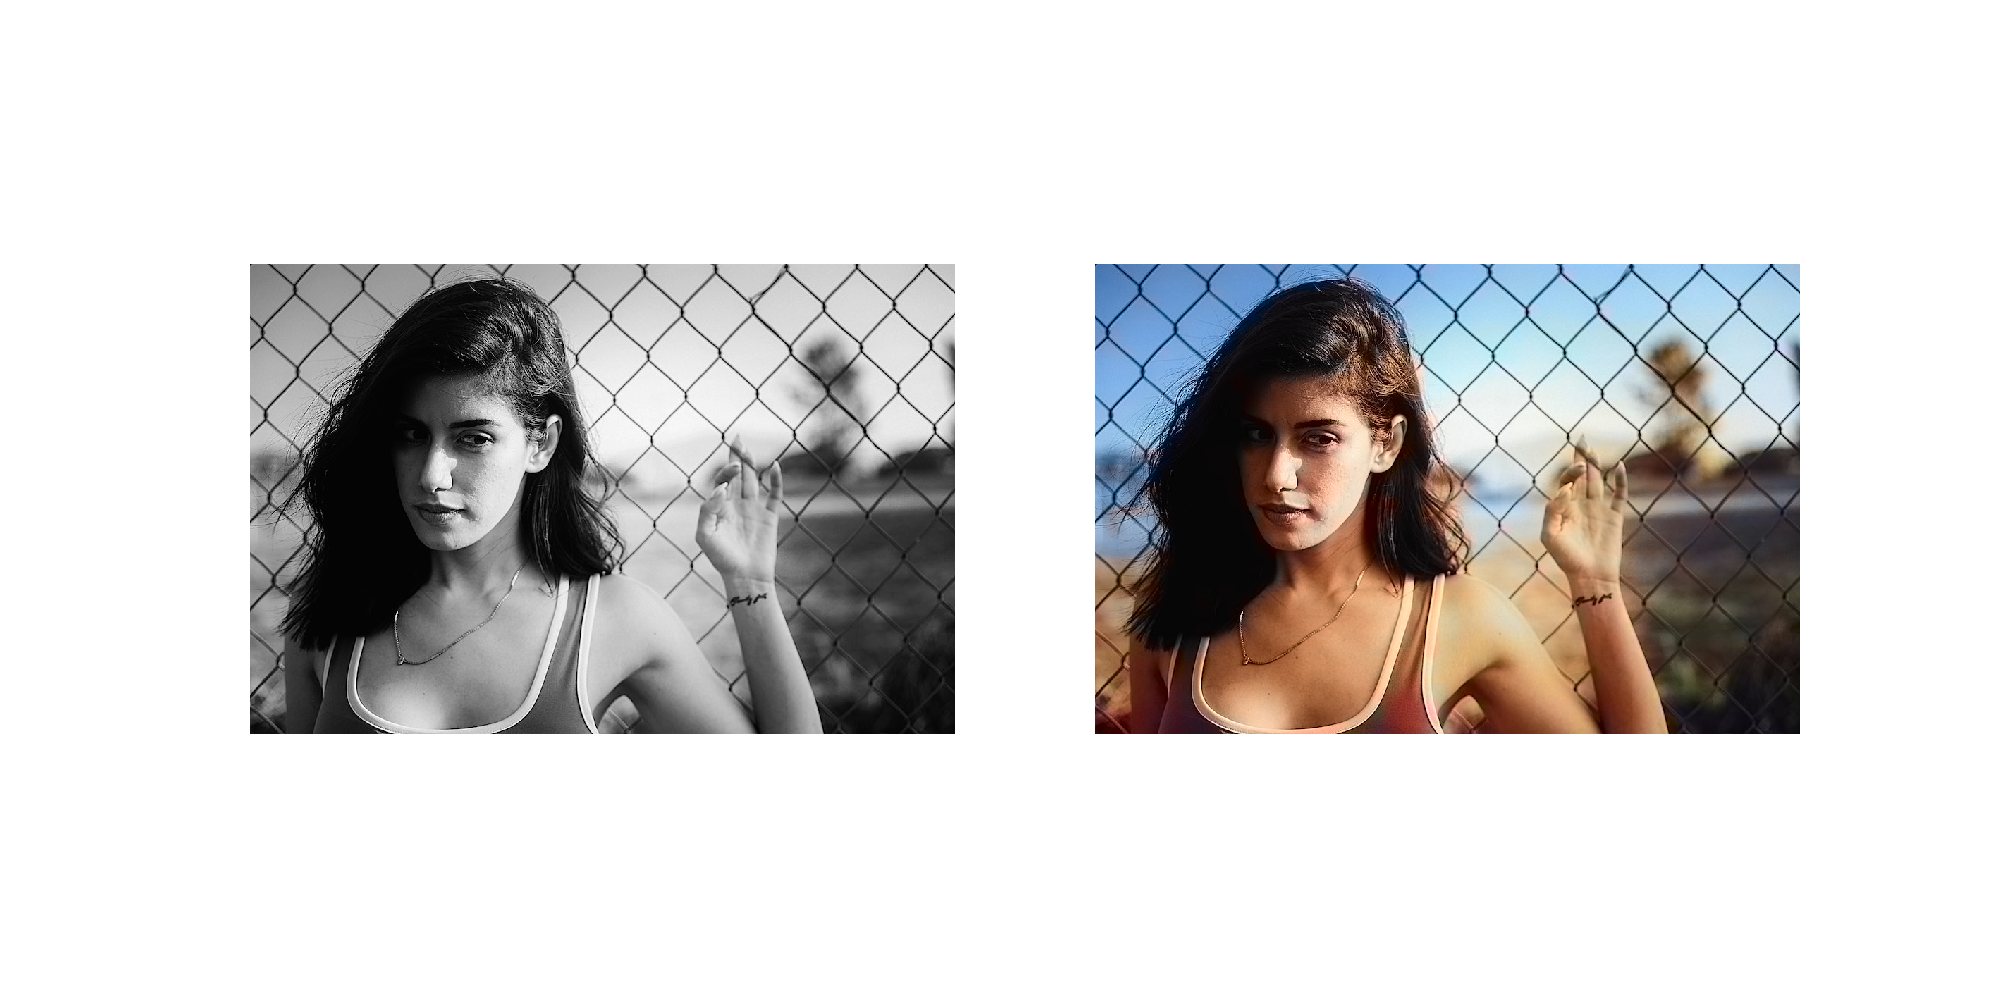
# plot prediction result
fig = plt.figure(figsize=(20, 10))
fig.add_subplot(1, 2, 1).axis('off')
plt.imshow(img_l, cmap='gray')
fig.add_subplot(1, 2, 2).axis('off')
plt.imshow(pred_rgb)
# plt.savefig(output_filename)
# save result image file
filename, ext = os.path.splitext(img_path)
input_filename = '%s_input%s' % (filename, ext)
output_filename = '%s_output%s' % (filename, ext)
pred_rgb_output = cv2.cvtColor(pred_rgb, cv2.COLOR_RGB2BGR)
cv2.imwrite(input_filename, img_input)
cv2.imwrite(output_filename, np.concatenate([img, pred_rgb_output], axis=1))
 >
>