Stock Price Prediction for LSTM

이탤릭 볼드 이탤릭볼드
Workflow stages
- Question or problem definition.
- Acquire training and testing data.
- Wrangle, prepare, cleanse the data.
- Analyze, identify patterns, and explore the data.
- Model, predict and solve the problem.
- Visualize, report, and present the problem solving steps and final solution.
- Supply or submit the results.
기본적으로 설치되어 있어야하는 패키지는 아래 코드 를 사용한다.
import pandas as pd
import numpy as np
import matplotlib.pyplot as plt
import tensorflow as tf
# from keras.callbacks import TensorBoard, ModelCheckpoint, ReduceLROnPlateau
import datetime
data 가져오기
data = pd.read_csv('dataset/005930.KS_20y.csv')
data.head()
Compute Mid Price
high_prices = data['High'].values
low_prices = data['Low'].values
mid_prices = (high_prices + low_prices) / 2

seq_len = 50  # window 사이즈. 최근 50일을 가지고 다음을 예측
sequence_length = seq_len + 1 # 예측값까지 51

result = []
for index in range(len(mid_prices) - sequence_length):
    result.append(mid_prices[index: index + sequence_length])
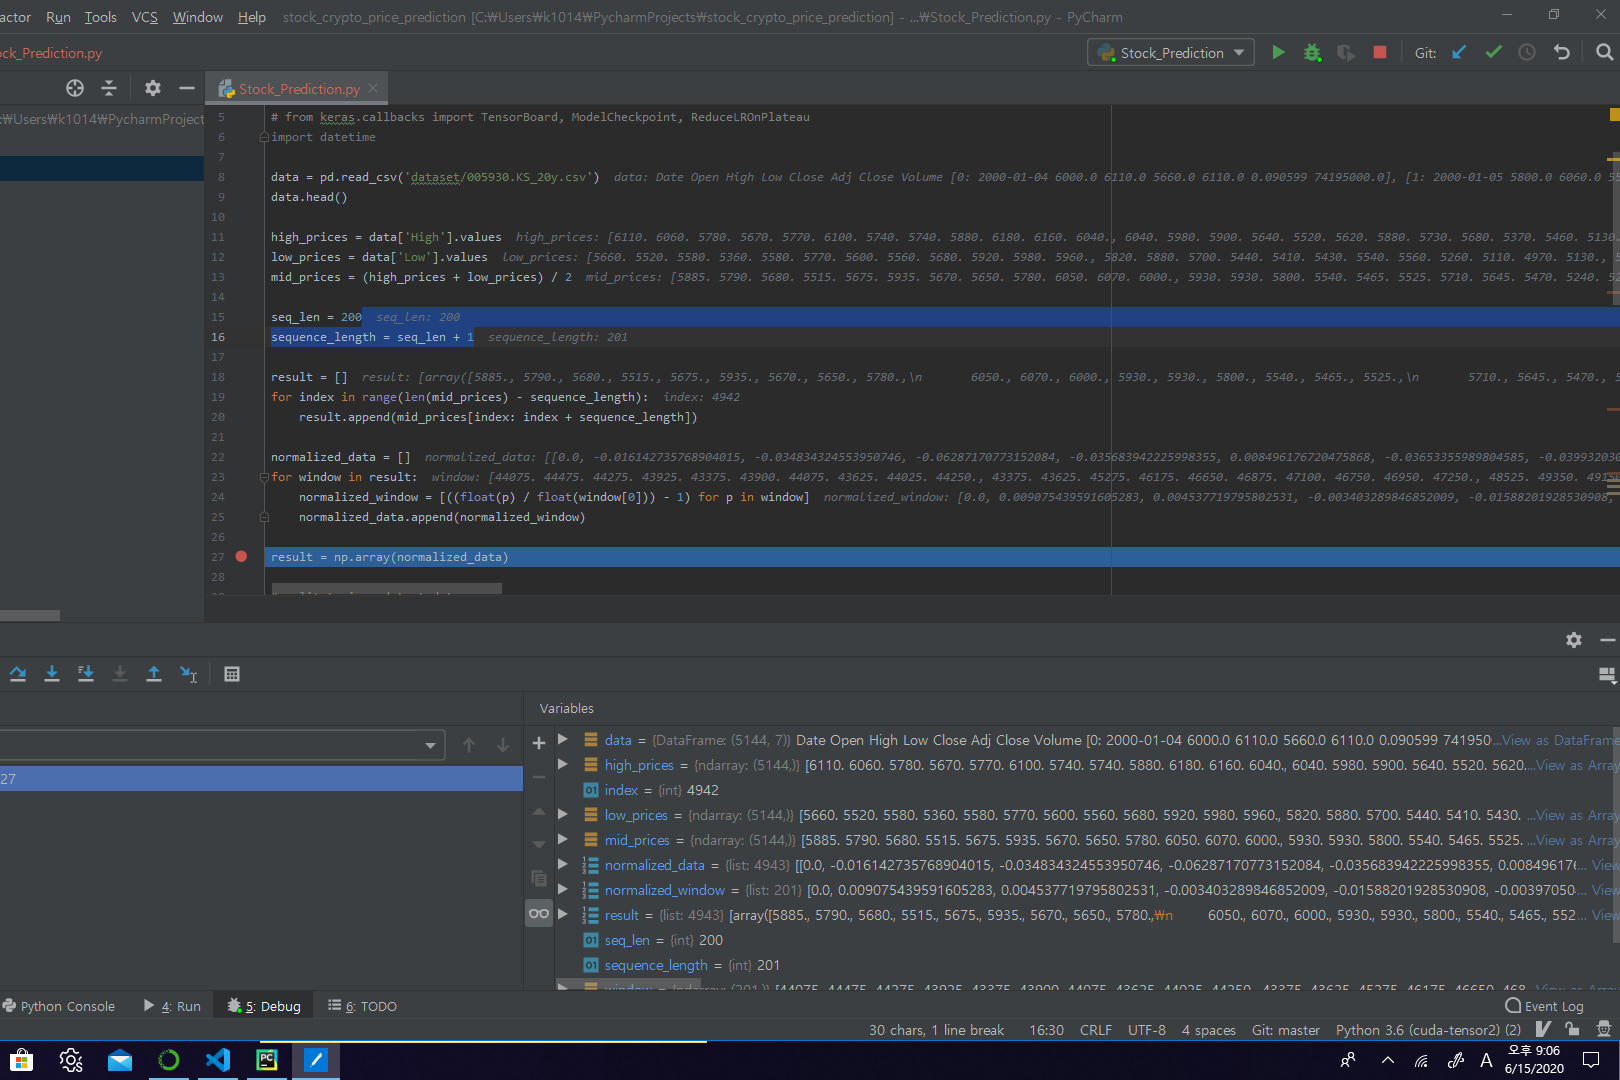
data 전처리
normalized_data = []
for window in result:
    normalized_window = [((float(p) / float(window[0])) - 1) for p in window]  # 윈도우의 값을
    normalized_data.append(normalized_window)

result = np.array(normalized_data)

# split train and test data
row = int(round(result.shape[0] * 0.9))
train = result[:row, :]
np.random.shuffle(train)

x_train = train[:, :-1]
x_train = np.reshape(x_train, (x_train.shape[0], x_train.shape[1], 1))
y_train = train[:, -1]

x_test = result[row:, :-1]
x_test = np.reshape(x_test, (x_test.shape[0], x_test.shape[1], 1))
y_test = result[row:, -1]

x_train.shape, x_test.shape
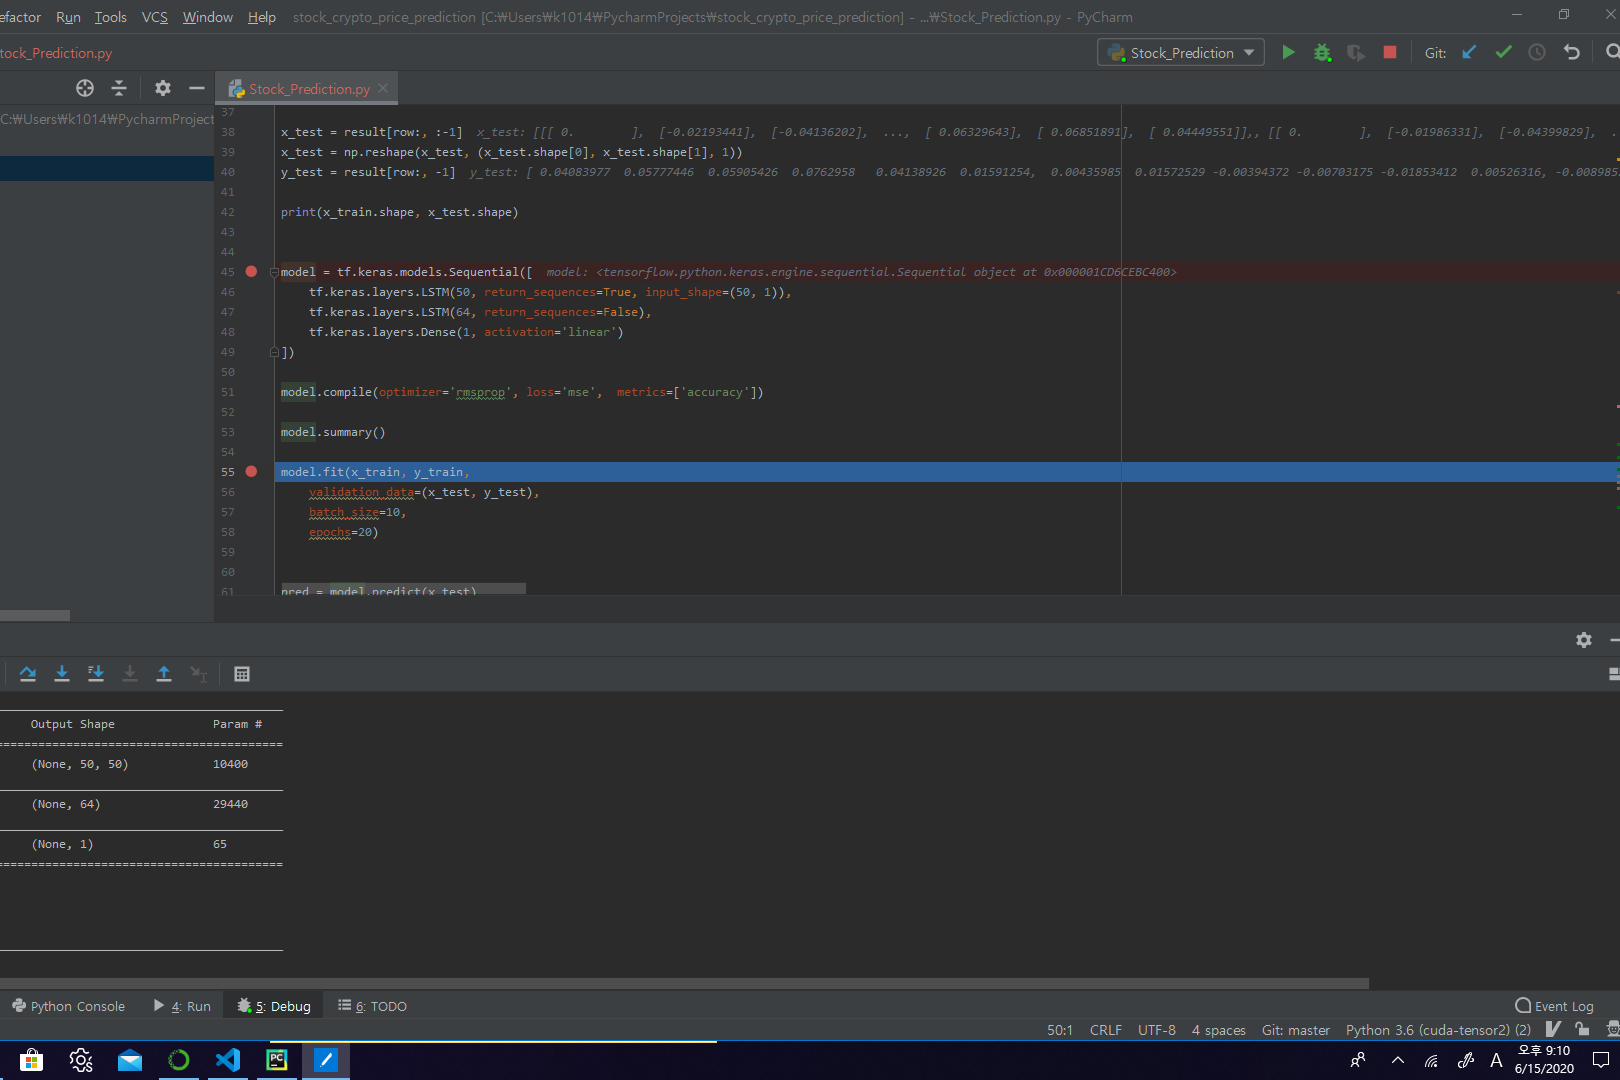
모델 생성
model = Sequential()

model.add(LSTM(50, return_sequences=True, input_shape=(50, 1)))

model.add(LSTM(64, return_sequences=False))

model.add(Dense(1, activation='linear'))

model.compile(loss='mse', optimizer='rmsprop')

model.summary()
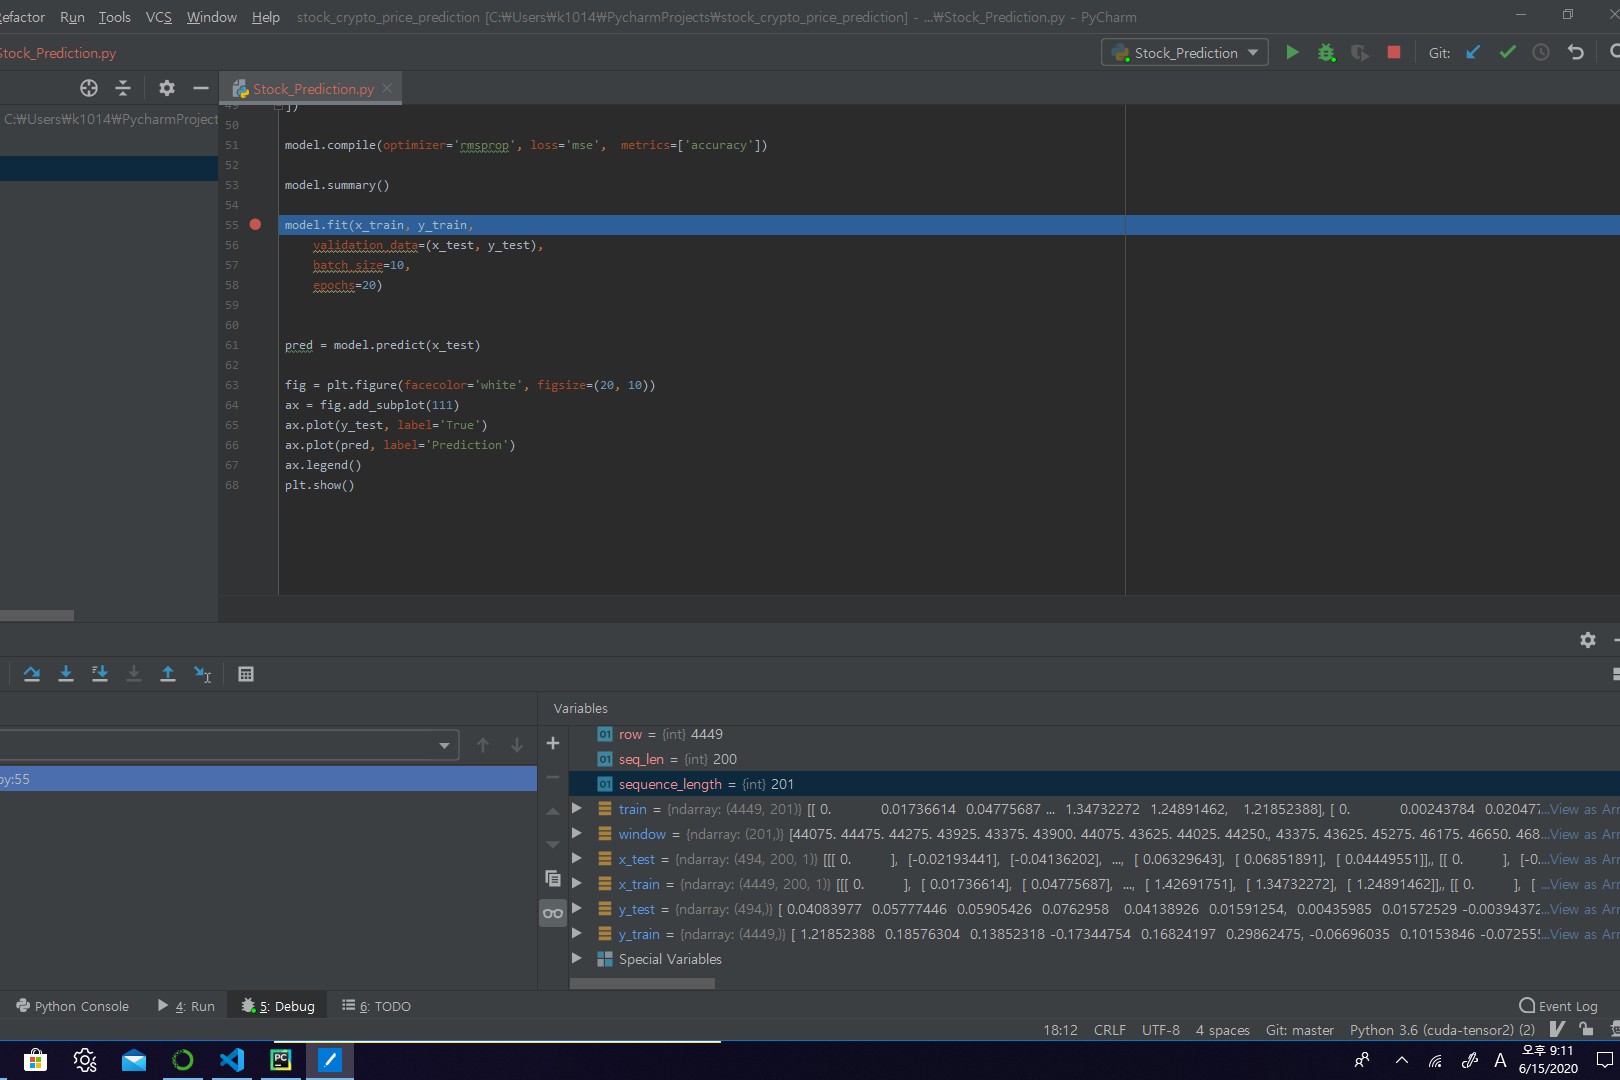
모델 학습
model.fit(x_train, y_train,
    validation_data=(x_test, y_test),
    batch_size=10,
    epochs=20)
모델 예측
pred = model.predict(x_test)

fig = plt.figure(facecolor='white', figsize=(20, 10))
ax = fig.add_subplot(111)
ax.plot(y_test, label='True')
ax.plot(pred, label='Prediction')
ax.legend()
plt.show()